How to Perform Memory Forensic Analysis in Windows 11 Using Volatility 3

Introduction
I already explained the memory forensics and volatility framework in my last article.
In this post, I will cover a tutorial on performing memory forensic analysis using volatility in a Windows 11 environment.
Windows 11 Memory Dump Acquisition
A memory dump, also known as a core dump or a system crash dump, is a file that contains a snapshot of the computer's memory at a specific point in time. It can be created manually or automatically when a system crash or error occurs.
A memory dump contains a wealth of information about the state of the system at the time of the dump, including running processes, open files, network connections, and much more. This information can be useful for troubleshooting system issues, investigating security incidents, and performing forensic analysis.
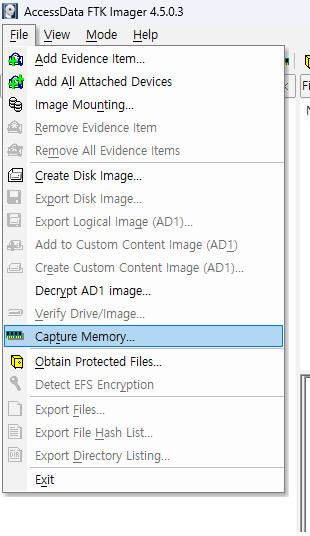
AccessData's FTK Imager tool is a widely used and reliable tool for creating memory dumps in a Windows environment. Here's an explanation of how easy it is to use FTK Imager to get a memory dump:
Download and install FTK Imager on the Windows system you want to create a memory dump of.
Launch FTK Imager and select "Capture Memory" from the "File" menu.
Choose the "Physical Memory" option and select the drive where you want to save the memory dump file.
Choose the memory dump format you want to create (such as Raw or Encase) and select any desired options, such as compressing the dump file.
Start the memory dump process by clicking the "Capture" button.
FTK Imager will create the memory dump file and save it to the specified location.

Overall, using FTK Imager to create a memory dump is a relatively straightforward process that does not require a high level of technical expertise. FTK Imager is also a widely used and trusted tool in the digital forensics community, making it a reliable option for creating memory dumps in a Windows environment.
volatility3 Tutorial (windows 11)
Creating config.json for Analysis
You can think of this as similar to creating profiles for different operating systems in the original Volatility. However, in the case of Windows operating systems, the process has become more convenient as it now automatically creates profiles.
For macOS and Linux, since it cannot be done automatically, it is recommended to use a separate project called dwarf2json to create and use profiles manually. (I plan to experiment with this later in the future.)
For now, in this article, we will practice using Windows 11 as the target operating system. the command is:
python3 vol.py --save-config config.json -f win11memdump.mem windows.info
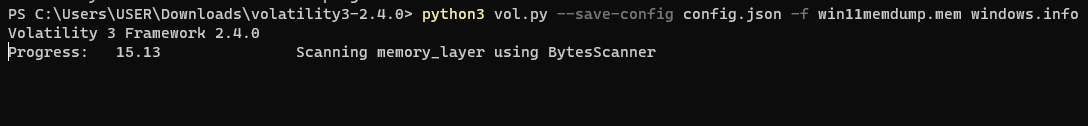
When you run this command, it takes some time to execute.
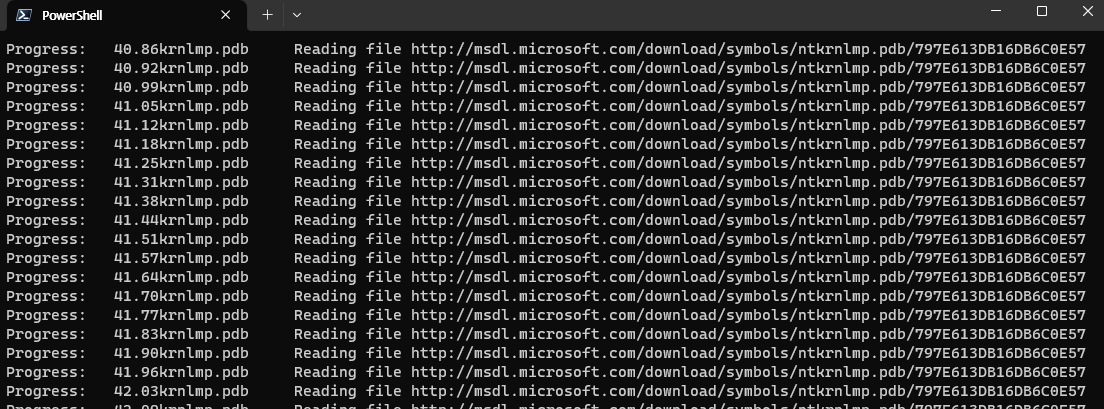
Automatic detection of 32-bit and 64-bit, as well as major/minor version information of the Windows operating system, is done during the initial analysis. It takes considerable time to perform the analysis for the first time, as it involves downloading necessary information from the Microsoft website and analyzing the memory layers.
The problem is that even after performing the analysis once, there is still waiting time when using plugins repeatedly, which could be avoided since the same tasks do not need to be repeated.
To address this issue, you can save the config separately during the initial image info analysis, and then specify the config file for subsequent plugin usage to speed up the analysis. This can be done by using the --save-config option, which creates a config.json file. The contents of the config.json file will look like this:
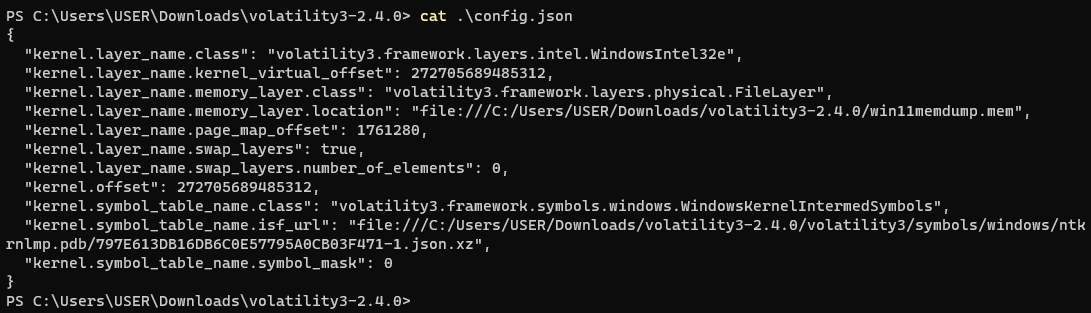
By using this config file (-c config.json), you can refer to it for subsequent analysis of the same memory image, allowing for faster analysis.
Now, let's take a closer look at the available profiles for Windows.
The following is a list of supported profiles for Windows:
windows.bigpools.BigPools, windows.cmdline.CmdLine, windows.dlllist.DllList, windows.driverirp.DriverIrp, windows.driverscan.DriverScan, windows.dumpfiles.DumpFiles, windows.envars.Envars, windows.filescan.FileScan, windows.getservicesids.GetServiceSIDs, windows.getsids.GetSIDs, windows.handles.Handles, windows.info.Info, windows.malfind.Malfind, windows.memmap.Memmap, windows.modscan.ModScan, windows.modules.Modules, windows.mutantscan.MutantScan, windows.netscan.NetScan, windows.netstat.NetStat, windows.poolscanner.PoolScanner, windows.privileges.Privs, windows.pslist.PsList, windows.psscan.PsScan, windows.pstree.PsTree, windows.registry.certificates.Certificates, windows.registry.hivelist.HiveList, windows.registry.hivescan.HiveScan, windows.registry.printkey.PrintKey, windows.registry.userassist.UserAssist, windows.ssdt.SSDT, windows.statistics.Statistics, windows.strings.Strings, windows.symlinkscan.SymlinkScan, windows.vadinfo.VadInfo, windows.virtmap.VirtMap
Let's focus on running some of the important plugins for Windows memory analysis.
pslist
This plugin displays the list of currently running processes, which is the most basic information for memory analysis.
python3 vol.py -c config.json -f win11memdump.mem windows.pslist.PsList
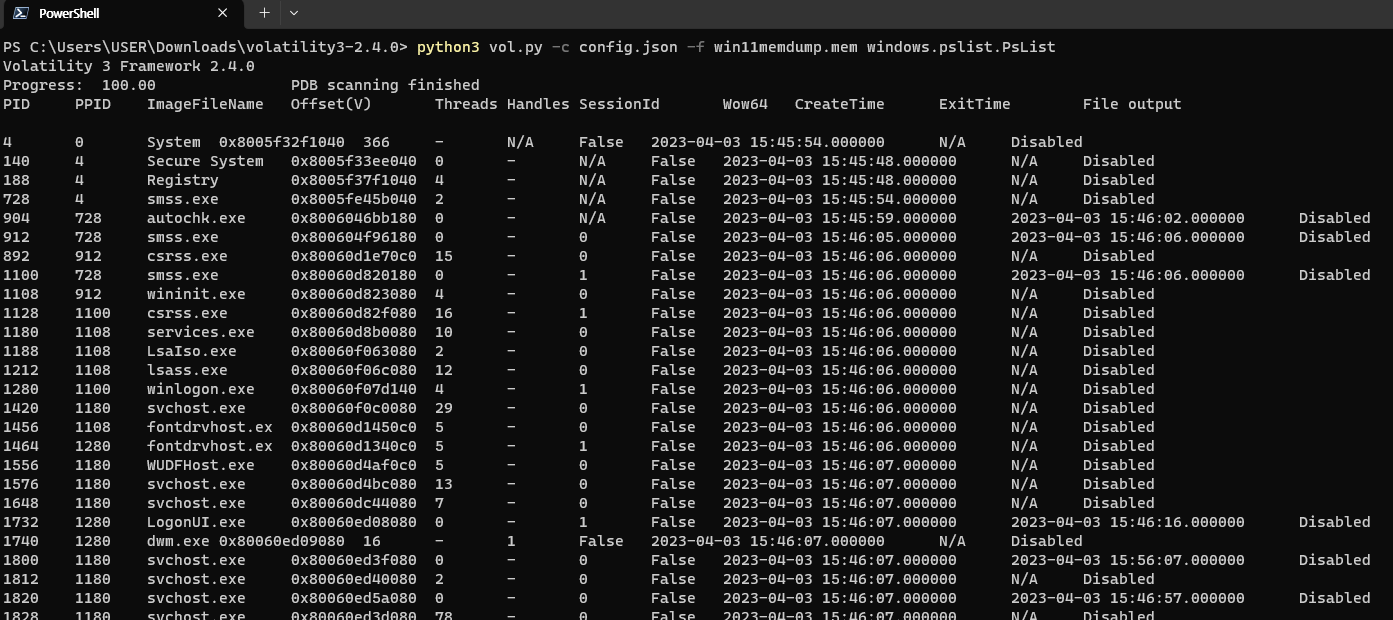
In addition, there are similar plugins such as psscan and pstree that you can refer to for Windows memory analysis.
procdump
Dumps the contents of a specific process specified by its PID.
python3 vol.py -c config.json -f win11memdump.mem windows.dumpfiles --pid 140

The target file and related DLLs have been dumped.
printkey
Prints the contents of registry entries with a specific key from the registry list.
python3 vol.py -c config.json -f win11memdump.mem windows.registry.printkey --key "Software\Microsoft\Windows\CurrentVersion"
However, upon testing, it appears that there are still some bugs in certain functionalities.
netscan
This plugin allows you to check the network connection status.
python3 vol.py -c config.json -f win11memdump.mem windows.netscan
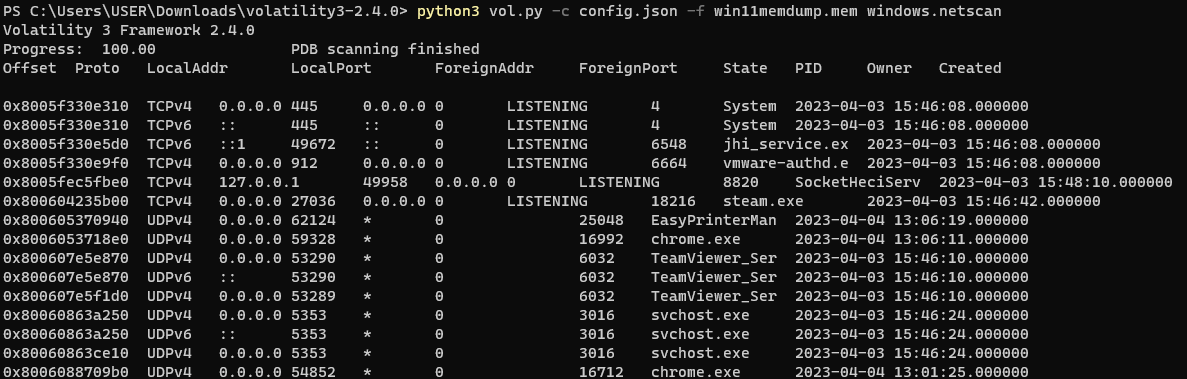
Additionally, there is also a netstat plugin available.
Conclusion
Since the end of Python 2's life, it is natural to transition to Python 3. While most Python libraries simply port the language to version 3, the Volatility development team seems to have completely re-implemented the framework from scratch with this opportunity. As a result, the analysis method has changed significantly.
The biggest advantage of using Volatility 3 is that it completely automatically detects the operating system profile and allows for self-downloading and analysis if needed. However, Linux or Mac cannot receive such features, of course.
As my main interest is Linux memory forensics, I plan to explore how to use Volatility 3 to analyze memory extracted from Linux in my next post.


![[Book Review] Hacking APIs](/_next/image?url=https%3A%2F%2Fcdn.hashnode.com%2Fres%2Fhashnode%2Fimage%2Fupload%2Fv1691992782649%2F8c13c6f2-bf1c-4042-8082-da97074cecdb.png&w=3840&q=75)
![[Book Review] Linux Basics for Hackers](/_next/image?url=https%3A%2F%2Fcdn.hashnode.com%2Fres%2Fhashnode%2Fimage%2Fupload%2Fv1686639994828%2F255a4c9e-9ff0-414f-97c3-804b99f3e12d.jpeg&w=3840&q=75)
![[Book Review] Black Hat Python, 2nd Edition](/_next/image?url=https%3A%2F%2Fcdn.hashnode.com%2Fres%2Fhashnode%2Fimage%2Fupload%2Fv1685081315794%2F260f0d5f-db1e-4604-bac3-0901c517fb8f.png&w=3840&q=75)